Tag Archives: analytics

Martech Part II: Why Marketing Analytics is a Bad Business

My post on martech was surprisingly well received, so I thought I might go deeper on a particular area of martech that no one is happy with, but it seems very few people attempt to solve: marketing analytics. I’ll pull no punches here: marketing analytics is a bad business. Sure, there are successful marketing analytics companies, and you can definitely build a successful marketing analytics company now. But when people complain to me about marketing analytics, they complain about something specific; that the tools to help me understand how well my marketing efforts are doing are harder to use than they should be. Solving that is bad business. The reason is that great marketers don’t understand what most marketers are hiring analytics products to do.

What does an average marketer want at a larger organization? Cynically, I can boil it down to two things:

  • To look good to their boss
  • More budget

It really is that simple sometimes. Yes, there are marketers that are motivated by the truth whether it makes them look good or bad, and marketers who have recommended they should not spend money they are offered because they don’t think they can do it efficiently. I love those people (like the Eventbrite marketing team 🙂 ), but they are the minority. When you get to the enterprise, most people want one or both of the bullets above. So what do most marketing analytics tools that focus on understanding how well a marketer’s marketing efforts are doing actually do in practice? They tell the marketer one of two things:

  • Their marketing spend is not efficient (read: they are not good at their job)
  • They should be spending less than they are currently spending

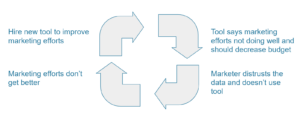
They literally do the exact opposite role the marketer hired them to do. This creates the Marketing Analytics Death Spiral:

  1. They hire a tool to achieve marketing goals, for which their proxies are their current efforts making them looking good to their boss and getting more budget
  2. The tool tells them the opposite of their goals in Step 1
  3. They think they are good at their job and deserve more budget, so they naturally distrust the data from the tool
  4. Since they don’t use the data, their marketing efforts don’t get better
  5. They look for new tool

The addressable market for marketers who will be willing to have a tool show them how ineffective they are and will use that tool to improve over time is just too small. People who read my first post may ask: why not just change the target customer? Sure, you can target the finance team or the CEO, who may be less biased as to the effectiveness of a marketing team’s current programs. But then your product creates organizational friction between either two different functions or the CEO and the marketing function. This is a tough win condition for most forms of go-to market.

So what are companies doing instead in this space? Well, Amplitude and Mixpanel decided to focus on analytics for product instead of marketing. If product or engineering becomes the position of strength inside an organization, they can extend their tools into other functions like marketing over time. Many other marketing tools focus on making the marketer more efficient through automation. This makes them look better to their boss, which is exactly the job to be done for most marketers. Another variation that is successful is making something measurable in the first place that historically has not. This tends to solve job #2 for marketers of making budget available to them when it previously was not. For example, it was hard to measure mobile app campaigns before companies like AppsFlyer and Adjust came along, so no one was approving large app install ad budgets. Once these tools became available, marketers adopted them so they could prove their CPA’s were effective to get more budget.


The marketing analytics space is so tempting because budgets are large, and there are many unanswered questions. But you can’t forget the job to be done for marketers. If you’re not helping them look good or get more budget, your market size is going to be too small focusing on the few that are not motivated by that.

Currently listening to Let’s Call It A Day by Move D & Benjamin Brunn.
The Analyst Career Path

I’ve written before about analytics teams as a crucial function in today’s technology companies. Technology companies are rapidly hiring analyst roles to pair with their product teams. And while my previous post discussed how to hire analysts and structure their teams within organizations, I haven’t written about how analysts should approach their careers.

Many technology roles, at startups in particular, have an issue with career progression. While established industries have defined career ladders, the path of career advancement is much less clear in many technology roles. Engineering, being the largest and oldest function in technology companies, now has a well defined individual contributor and manager career path all the way up to VP Engineering and CTO. Product Managers know they can progress to manager roles at their companies all the way to VP Product, and if they want to remain and individual contributor, they can still grow by working on more and more complex and strategic products over time. As I’ve talked to many analysts and analytics teams, this progression is not as well defined. I will outline how I think about this progression as someone who has been an analyst and managed analysts.

Option 1: Graduate into Data Science

If someone wants to remain an individual contributor and not manage, at some point the only way to become a better analyst is to graduate into a data science role. Now, there is some confusion with where the line is between analyst and data scientist, and many companies just call all of their analysts data science as a form of title inflation. I define the role of an analyst as someone who uses data to help identify and communicate business opportunities, and drive decisions for teams. This includes targeted analysis driven by others as well as free form analysis driven the analyst. From a process perspective, this includes everything from making recommendations, helping with experimentation, and creating dashboards to help others make decisions. From a tooling perspective, this means everything from writing SQL queries, identifying logging opportunities for product engineering and database design opportunities with data engineering, creating new dashboards and visualizations. An analyst retrieves, analyzes, and recommends, and is judged by not only how good those recommendations are, but how often they are followed.

So, how does data science differ? A data scientist writes code beyond SQL to manipulate data for analysis and potentially for product experience. A data scientist can write an algorithm that powers a personalized experience in the product, or just do more complicated analyses requiring more sophisticated querying using Python, R, etc. Data scientists jump in when analyses are too complicated to be handled by analysts, and also frequently partner or embed with product and engineering teams to change the product. This is more than just a higher-power analyst role though. Data scientists have deep expertise in certain areas, like machine learning, statistical inference, and focus on solving specific, hard problems over longer time horizons.

Option 2: Become an Analytics Manager
If you wish to get on a management track, becoming an analytics manager is the natural path. Since analysts are being hired so frequently, they need managers who can mentor and coordinate learnings between teams. While analysts are best embedded, analytics management bears the important responsibility of solving company-wide analytics issues related to tooling, process, etc.

Option 3: Graduate into Product Management
The third path that analysts can choose to grow their career is migrate into product management. Technically, product managers and analysts are peers in cross-functional teams, but product management has better career pathing that doesn’t require as much technical investment as data science, and product managers tend to have a bit more power in organizations today.

The migration of analysts to product manager is increasingly common as more and more product teams rely on data as the foundation for most decision-making. This has certainly been most true on growth teams and teams that utilize personalization, but I believe all future product teams are data savvy. A significant percentage of product managers at Pinterest started as analysts at the company. This same migration is also true for marketing analysts. They tend to become quantitative marketers over time, or switch to product analytics.


Being successful as an analyst is peculiar is that it almost requires a switch in roles over the time in ways that are not true for design, engineering, and many other roles in technology companies. Fortunately, the analyst has a lot of choices on how to progress within an organization. Hopefully, managers of analysts get better at outlining these different opportunities and help analysts position themselves toward the best ones for them over time.

Thanks to George Xing for reading early drafts of this.

Currently listening to Compro by Skee Mask.

The Three Personas: How Marketing, Product, and Analytics Attempt to Define The Customer

In my career, I’ve worked in marketing, product, and analytics. While the American Marketing Association defines all of that as marketing, the reality is those are rarely under the scope of one functional team, and the people in those groups see things very differently much of the time. One of the key ways this manifests that creates confusion for the organization is in the creation of personas. All three groups have their own ways to define personas that don’t tell the same story. And in many cases, these are called marketing personas even though they are very different. I’ll walk through each of them to try to define them separately, and talk about how to use each of them best and avoid common pitfalls.

The Analytics Persona
The analytics persona is the most straightforward of the group. The analytics persona is created by looking at clusters of users based on their usage and defining them based on that usage. At Pinterest, these were defined as core, casual, marginal, and dormant users. Core people came every day, casual people came every week, marginal people came every month, and dormant users had stopped coming to Pinterest altogether. This segmentation can be useful to see if your product is becoming more or less engaging over time. Key projects can include migrating people from, say, marginal to casual, by understanding the statistical differences between the two groups. Then, a product team might take something the casual group does that the marginal group does not and try to make the marginal group try to do that thing as well. Some of these differences are just correlation (or represent the people more so than the action itself being important), but some may be causal, and experiments like incentives or education to marginal users may help them become casual users.

The Product Persona
The product persona, just like the analytics persona, focuses on understanding existing users. In contrast to the the analytics persona, it relies on qualitative research to define who these people are, not just what actions they take. Someone that uses the product monthly can be the same persona as someone who uses it every day. When we built our personas at Grubhub, we had to use a mix of qualitative and quantitative research to define them. After a back of forth of customer calls and surveys, we were able to define four personas that used Grubhub based on two specific criteria: whether they ordered spontaneously or planned ahead of time, and whether they ordered for themselves or with others. When we mapped these personas back to our data, we were able to find that one segment was detrimental to serve because of high customer service costs, and that one segment was high potential, but low value currently because we had not built the right product for them yet. This helped inform our product strategy for the future.

The Marketing Persona
The marketing persona, unlike the first two personas, is usually a forward-looking persona: about who the company is going to try to reach. These are customers you want rather than customers you have. Marketing personas are common for product launches and market expansions since there are no existing users or data to build analytics or product personas.

The marketing persona exists to define a target market to go after. Marketers rarely try to target all people. They attempt to define a niche with specific needs (physical and emotional) and make their product attractive to that group. Marketers have many tools to define this persona. They pore over demographic and psychographic data and map competitive landscapes to spot opportunities for new markets. Since this persona is about targeting people outside the product, one common tool created during this process is a mapping of the target customer’s typical day. What they listen to on the radio on the trip to work, where they get their morning coffee, what they watch on TV during dinner, etc. From that, marketers identify opportunities to advertise to the target during one of those times to introduce them to the product.

Issues with Different Personas
All of these personas have pros and cons, and I recommend using them in tandem rather than a one size fits all approach. The danger with the analytics persona is it looks at people solely based on their activity and not also their motivations, their personalities, etc. There are key insights you will never find out from data that you can learn within ten minutes by talking to a customer. The product and the analytics personas also assume the current customers are the most important customers to understand. This is not always the case. Many times, you need to expand your market. Other times, focusing on existing users makes the product worse for incoming users.

Marketing personas also have their flaws. Since they are based on secondary data, marketers can sometimes invent personas that don’t exist or are too small to be important. This is why so many marketing teams create personas that are just cooler versions of themselves. It’s why whenever a fashion designer is asked who they design for, they say something like “a gallery owner in New York City.” They are maybe 500 of those people in the world. Now, I should be clear in that last scenario there is a blurred line between the marketing persona and the aspirations of the true persona, but you get the idea.

Marketing personas also can be unhelpful to some organic growth strategies or for products that have infinitely large markets since they are based on niches and targeting. When we tried to build marketing personas to target at Pinterest at around 50 million users, I asked, “What exactly are we going to do with this? We don’t spend money on advertising. Our targeting is defined by whoever searches for something on the internet that Pinterest is relevant for.” Similarly, does Google search have a target market? Sure, if you can call every single person with an internet connection a target. I bet you the Google Home team had a very specific target in mind for its launch though.

Personas of all types are also mistakenly used in lieu of personalization for many internet products. Email is a common example. Many companies still spend a lot of time creating dedicated emails for specific personas, segmenting lists, writing custom copy, and adding custom content. This frequently doesn’t makes sense in a world of personalization and one to one messaging. Pinterest has automated, personalized one to one messaging across email and push to over 200 million users. It doesn’t need to know what analytics, product, or marketing persona you are to be effective. This is not proprietary tech either. Many third party companies can help build this same type of system for smaller companies with less data.


Personas are very useful tools to help you identify opportunities to grow your business and better serve your customers. You should be using them in almost all phases of a company. Understanding the different types of personas, how you could use them, and how to prevent making mistakes with them is key to making sure they are worth the effort to define them.

Currently listening to Big Loada by Squarepusher.

How to Set Up and Hire an Analytics Team


Analytics has become a critical role at tech companies. A common question I receive is how to hire analysts and where they fit into an organizational structure. Below I share some tribal knowledge around common team structures, options I think work best and hiring tips that leverage this talent.

Functional vs. Embedded Teams
One of the first questions organizations face when hiring analysts is how they should structure the team. There are two common choices organizations pursue: a functional and an embedded model. The functional model is an analytics team reporting to a Head of Analytics. In the embedded model, every department (sales, marketing, product, customer service et al.) is in charge of solving for its analytics needs, hiring analysts for their teams when needed, and determining to whom they report.

Benefits of the functional model are having a senior seat at the table in major discussions for the company. The advantages this presents is getting analytics its own budget for tools and infrastructure and solving other analyst specific needs that may not be a top priority on any other specific department. The downside of a functional team is how analysts’ time are allocated. In a functional team, an analysts’ time is usually allocated on a project by project level, meaning they usually enter a project once that project is already well defined (whereas analytics could have helped by define the project, had it been involved earlier). And the analyst has not developed any specific expertise for that area. In my experience, analysts get frustrated in this model because they can’t go deep into any one area, and the other departments get frustrated because analysts provide a more cursory benefit than expected.

The embedded model solves a lot of these pain points, but introduces its own. With an embedded model, analysts are hired into one specific team, and therefore can develop expertise for that team very quickly. Teams are happy because they always have a teammate ready to help who understands their problems. While analysts seem to be happier in this model, the downsides are the reverse of the functional model. When there are cross-departmental analytics needs, they usually fall by the wayside. Investment in infrastructure and tooling is usually massively under-invested in, and it’s unclear where budget comes from to solve these needs.

At Apartments.com and at Grubhub, we implemented the embedded model. Marketing took control of analytics infrastructure initially, but we had trouble applying it cross-functionally. The analysts across all teams started meeting regularly to share learnings, but also limitations. When we added the Seamless team into Grubhub, they were used to the functional model. Analyzing the two together created awareness for me of a new approach.

The Hybrid Model
At Grubhub, the value of a dedicated analytics team for infrastructure and tools became clear, but also the value of the embedded analyst. Once I started at Pinterest and dealt with the functional model, we began to work toward a hybrid approach. This is a dedicated analytics team with a Head of Analytics, but with the analysts dedicated to specific areas full-time. So the person reports to a Head of Analytics, but sits with the department they support (in my case, the growth team). As the growth team grew, we created a Growth Analytics Lead who reported to the Head of Analytics and managed other growth analysts dedicated to specific areas, like conversion optimization or on-boarding. This allowed Pinterest to have the analytics seat at the table for budgets and resourcing, but the expertise at the team level to make the most impact. It’s now what I recommend to all teams that are scaling.

Hiring Analysts
If you are scaling a company and need more analytics help, it can be hard to understand who to hire that will actually help your teams. Hiring from analysts at other companies, especially larger ones, proved not to be a great strategy for me. I found during the interview process that most analysts were actually what I call “reporters”, in that they ran well defined reports for people who needed them but didn’t actually analyze anything. If you read analyst job descriptions, they inadvertently screen for these types of people by saying the candidate needs experience with all of these special tools. I can’t tell you how many job requirements that list Omniture (or whatever it’s called this week), Google Analytics, SPSS, Tableau, etc.

Experience with tools is not actually what you care about (though SQL and Excel are a big help). The more tools someone has worked with, the less likely they are to analyze the output of those tools. What you actually want are people who are analytically curious. Our first successful analyst at Grubhub was a new graduate whose cover letter talked about how he tracked his sleep patterns and his diet to find ways to improve his health. He crushed dozens of analysts with multiple years’ experience in our interviews because he was using his brain to analyze results instead of just report. So I now screen for roles where analysis, not reporting, is the unit of value. Many analyst teams at other companies are structured that way, but the majority are not.

You also have to test analytical ability in these interviews. At Grubhub, I gave people a laptop with a bunch of data in Excel and some vague questions to answer from it. The question was based on a real question we gave an analyst intern, who returned it to me saying there was no trend in the data. I ran the analysis myself and found one of the most important correlations for our business (the impact of restaurants per search on the likelihood to order). So I said, you have to be better than our intern to get an offer. It turned out to be an incredible screener. Most people never got far with the data, or their answers were spectacularly wrong. The few good analysts cut right through to a direct way to solve the problem and could explain it easily.

I like this approach because it actually shows the analyst what the job is (and if they’ll like it), and I can walk the candidate through how I would solve the problem so if they did get it wrong, they could learn something from it.

 — 
Analytics team are one of the hardest teams to scale. One of the keys is building a model of a team that will scale with the needs of a company, and the hybrid model is the best model I have found to maximize the important levers of effectiveness (and happiness!). Structure is not all that is important though. Hiring the right candidate is critical, and the market is doing a poor job of preparing people for what emerging companies actually need in an analytics organization. If you can hire correctly and structure correctly though, you will have a competitive advantage over those who do not.

Currently listening to Rezzett by Rezzett.

Don’t Become a Victim of One Key Metric

The One Key Metric, North Star Metric, or One Metric That Matters has become standard operating procedure in startups as a way to manage a growing business. Pick a metric that correlates the most to success, and make sure it is an activity metric, not a vanity metric. In principle, this solves a lot of problems. It has people chasing problems that affect user engagement instead of top line metrics that look nice for the business. I have seen it abused multiple times though, and I’ll point to a few examples of how it can go wrong.

Let’s start with Pinterest. Pinterest is a complicated ecosystem. It involves content creators (the people who make the content we link to), content curators (the people who bring the content into Pinterest), and content consumers (the people who view and save that content). Similar to a marketplace, all of these have to work in concert to create a strong product. If no new content comes in, there are less new things to save or consume, leading to a less engaging experience. Pinterest has tried various times over the years to optimize this complex ecosystem using one key metric. At first, it was MAUs. Then it became clear that the company could optimize usage on the margin, instead of very engaged users. So, the company then thought about what metric really showed a person got value out of what Pinterest showed them. This led to the creation of a WARC, a weekly active repinner or clicker. A repin is a save of content already on Pinterest. A click is a clickthrough to the source of the content from Pinterest. Both indicate Pinterest showed you something interesting. A weekly event made it impossible to optimize for marginal activity.

There are two issues at play here. The first is the combination of two actions: a repin and a click. This creates what our head of product calls false rigor. You can do an experiment that increases WARCs that might actually trade off repins for clicks or vice versa and not even realize it because the combined metric increased. Take that to the extreme, and the algorithm optimizes clickbait images instead of really interesting content, and the metrics make it appear that engagement is increasing. It might be, but it is an empty calorie form that will affect engagement in a very negative way over the long term.

The second issue is how it ignores the supply side of the network entirely. No team wants to spend time on increasing unique content or surfacing new content more often when there is tried and true content that we know drives clicks and repins. This will cause content recycling and stale content for a service that wants to provide new ideas. Obviously, Pinterest doesn’t use WARCs anymore as its one key metric, but the search for one key metric at all for a complex ecosystem like Pinterest over-simplifies how the ecosystem works and prevents anyone from focusing on understanding the different elements of that ecosystem. You want the opposite to be true. You want everyone focused on understanding how different elements work together in this ecosystem. The one key metric can make you think that is not important.

Another example is Grubhub vs. Seamless. These were very similar businesses with different key metrics. Grubhub never subscribed entirely to the one key metric philosophy, so we always looked at quite a few metrics to analyze the health of the business. But if we were forced to boil it down to one, it would be revenue. Seamless used gross merchandise volume. On the surface, these two appear to be the same. If you break the metrics down though, you’ll notice one difference, and it had a profound impact on how the businesses ran.

One way to think of it is that revenue is a subset of GMV, therefore GMV is a better metric to focus on. Another way to think of it is the reverse. Revenue equals GMV multiplied by a commission rate for the marketplace. So, what did they do differently because of this change? Well, Seamless optimized for orders and order size, as that increased GMV. Grubhub optimized for orders, order size, and average commission rate. So, while Seamless would show restaurants in alphabetical order in their search results, Grubhub sorted restaurants by the average commission we made from their orders. Later on, Grubhub had the opportunity to test average commission of a restaurant along with its conversion rate, to maximize that an order would happen and maximize its commission for the business. When GrubHub and Seamless became one company, this was one of the first changes that was made to the Seamless model as it would drastically increase revenue for the business even though it didn’t affect GMV.

This is not to say that revenue is a great one key metric. It may be better than GMV, but it’s not a good one. Homejoy, a service for cleaners, optimized for revenue. Their team found it was easier to optimize for revenue by driving first time use instead of repeat engagement. As a result, their retention rates were terrible, and they eventually shut down.

Startups are complicated businesses. Fooling anyone at the company that only one metric matters oversimplifies what is important to work on, and can create tradeoffs that companies don’t realize they are making. Figure out the portfolio of metrics that matter for a business and track them all religiously. You will always have to make tradeoffs between metrics in business, but they should be done explicitly and not hide opportunities.

Currently listening to A Mineral Love by Bibio.

The Perils and Benefits of AB Testing

Bob, our head of product design at Pinterest, asked me to write up a post on the perils and benefits of AB testing after reading my post on building cross-functional teams. This is me obliging.

One thing it is never difficult to do is to convince an engineer to do an experiment. In general, this is a good thing. Famous engineer W. Edwards Deming said, “In God we trust, all others bring data.” AB experiments generate data, and data settles arguments. AB experiments have helped us move from product decisions made by HIPPO (highest paid person’s opinion) to those made by effectiveness. We build better products as a result that delight more people.

An AB experiment culture can also have a dark side though. Once people figure out that AB experiments can settle disputes where multiple viewpoints are valid, that fact can lead people to not make any decisions at all and test everything. I liken this type of approach to being in a dark room and feeling around for a door. If you blindly experiment, you might find the way out. But turning the light on would make it way easier. Rabid AB testing can be an excuse for not searching for those light bulbs. It can be thought of as easier to experiment than to actually talk to your users or develop a strategy or vision for a product. Here are some perils and benefits of AB testing to think about as you experiment in your organization.

Benefits
1) Quantifying Impact
This one is pretty obvious. AB experiments tell you exactly what the lift or decrease a treatment causes versus a control. So, you can always answer the question of what an investment in Project X did for the company.

2) Limiting Effort on Bad Ideas
Another great benefit of AB testing is that you can receive feedback on an idea before committing a ton of effort into it. Not sure if an investment in a new project is worth it from a design and engineering perspective? Whip up a quick prototype and put it in front of people. If they don’t like it, then you didn’t waste a lot of time on it.

3) Limiting Negative Impact of Projects
Most additions to a product hurt performance. AB testing allows you to test on only a segment of an audience and receive feedback without it affecting all users. Obviously, the larger the company, the smaller the percentage you can trigger an experiment on to get a solid read.

4) Learning What Makes Something Work
In AB experiments, you isolate one variable at a time, so you know exactly what causes a change in metrics. You don’t have to debate about whether it was a headline or background color or the logo size anymore.

Perils
1) Not Building a Strategy or Vision
Many places convince themselves that testing is a strategy in and of itself. While AB testing can inform a strategy or vision, it is not one in and of itself. What happens in these cases is that companies do tons of random experiments in totally different directions, and their failure rate is very high because they have no unifying vision on what they are trying to do.

2) Wasting Time
AB testing can slow companies down when they convince themselves that every single thing needs to be tested thoroughly. Everyone knows of the anecdote from Google where they tested 41 shades of blue.

3) Optimizing for the Wrong Metric
AB experiments are designed to measure the impact of a change on a metric. If you don’t pick the right metric or do not evaluate all of the important ones, you can be making tradeoffs in your product you do not realize. For example, revenue over user engagement.

4) Hitting A Local Maxima
AB experiments do a very good job at helping optimize a design. They do not do as well as helping to identify bold new designs that may one day beat current designs. This leads many companies to stay stuck in a design rut where their current experience is so well optimized, they can’t change anything. You need to be able to challenge assumptions and invest in a new designs that may need quite a bit of time to beat control. This is why most travels sites look like they were last re-designed in 2003.

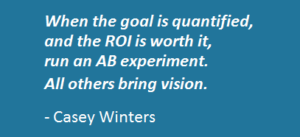
So, I’d prefer to optimize Deming’s quote to “When the goal is quantified and the ROI is worth it, run an AB experiment. All others bring vision.” It doesn’t have quite the same ring to it.

Currently listening to Forsyth Gardens by Prefuse 73.

With Growth, Don’t Forget About the Long Term

Growth is an area for startups that is traditionally aggressively short-term focused. Development cycles are quick, results are measured in experiments as soon as things go out, and we react to all this data. Because of the nature of most startups, most marketing or growth tactics focus on acquisition as well. Getting more people in the door is almost every startup’s biggest issue.

This creates some challenges to doing long-term effective growth. I’ll highlight a few examples I’ve run into, and one tip on evaluating the more nuanced balance between short and long term growth.

At GrubHub, we added a feature for someone to sign up as a guest and order very early on as a company. The reasoning for this was simple. The easier we made it for someone to check out (or the easier it was perceived), the more likely an order would be completed and we’d make money. People visiting GrubHub are hungry, and hunger and patience don’t typically co-exist well.

Way off into the future, we started noticing our one month repeat purchase rate for new diners started to sink below our previous year’s levels. This had never happened before. We’d also continued to growth our repeat purchase rates year over year. Obviously, we were bringing in more new diners, so we thought it could be a natural decline in quality as you target less early adopters and a bigger base. So, the first thing we looked at was our repeat purchase rates by referral source. Most of our referral sources were down, so it wasn’t one new channel that was causing this.

Then, we cut the data by guest vs. Facebook vs. account creations. Over half of our new diners joined as guests. When looking at the data this way, it was clear that guest repeat purchase rate was declining rapidly, but the other types of accounts were doing well with driving repeat purchasers. So, we faced a decision. Do we remove the ability to order as a guest and potentially lose half of our new diners?

We decided to test redesigning the signup page, amplifying the value of creating an account, and hiding the guest option at the very bottom with a link that said “I don’t like convenience. Sign me in as a guest.” We monitored overall conversion rate, and repeat purchase rate. What we found is that conversion rate did not decrease and the types of diners that were creating guest accounts historically began creating real accounts. What we also found is that our repeat purchase rate went back up. Something about selling the value of GrubHub as a service and not just a one time transaction made these people stick around. This was the first time we learned that something we did to make it harder to acquire a new customer could actually beneficial for our business over the long term.

We had a similar issue on the paid marketing side once at GrubHub. It might sound silly now, but group buying sites were all the rage as distribution channels a few years ago. The organization really wanted to try it as a way to boost demand in emerging markets for us. We had never really discounted our product before, so there were some serious concerns as to the long term effect of that, but we tried it anyway.

We gave $10 off $20 worth of food at any restaurant, and we got a ton of new customers. Those that used the coupons the first week also became great customers of GrubHub. Our one month repeat purchase rate for them was great. The company quickly wanted to scale the program to other cities. But I had recently instituted a new way to track any marketing initiative. The process was to track every initiative after one week, one month, and six months. Our one week and one month data was great, but when we did our six month look back on these sites, the data changed. What happened was that the people that used the coupon immediately were still good customers, but the many people who waited until the coupon was expiring to use it were not. They never returned. So, the overall program had a poor LTV that did not justify the acquisition costs.

I highlight these two examples to point out that it’s easy to sacrifice the long term growth of a startup with short term measurement and initiatives. Don’t be fooled. Measure everything you’re doing on short and long term effects, and think about the long term impact of something you might implement to shoot up short term numbers. Don’t let acquisition zeal ruin your retention. The one week, one month, six month rule is a great way to prevent short term growth decisions from taking you down a negative path. Find out what those cycles are for your business, and be diligent about measuring them for any acquisition channel you try.

Track Yourself Before You Wreck Yourself, or How To Track Your Brand Online

In my various rounds of speaking engagements on social media with my partner in crime Amy Le, I have been including a slide on general brand tracking/monitoring. This slide always receives a bunch of questions, so I am posting this how-to online so anyone can figure out how to track mentions of their brand anywhere and everywhere on the internet. Now, if you’re frugal, there isn’t one great system to compile every possible mention of a keyword across the internet. But if you use about four different ones, you can get everything.

Twitter

This is probably the section most people know how to do already, but it is where the most mentions originate, so I still include it first. Thanks to Twitter’s home page redesign, most users know they can search Twitter and see all mentions of a brand or keyword. Well, what if you don’t want to keep refreshing Twitter all day? Applications exist for all mobile and desktop platforms to notify you when new comments mentioning your brand or any keywords you want to track exist. My favorite of the free platforms is Tweetdeck, though Seesmic is pretty similar. Tweetdeck in particular also pulls in data from Facebook, Foursquare, and LinkedIn related to your accounts on those platforms, but is not able to scan data mentioning your brand on them due to the lack of public availability. Tweetdeck and Seesmic are available as desktop applications that can be hidden in your tray until you receive a notification as well as all mobile devices. Reply to people if it makes sense and retweet some complimentary remarks.

One note here: Neither Tweetdeck not Seesmic will remain free forever. It’s important to note that there are other players in the space that already charge and may be better suited for your more aggregate monitoring needs, such as SproutSocial, HootSuite, Radian6, et al. This post focuses on free apps, but want to make sure you keep this in mind.

Tweetdeck Search for GrubHub

Forums

I know what you’re thinking. People still use forums? Hell yeah they do, and you should know what people are saying about you on them. BoardReader allows you to search all forums for mentions of your brand. What makes BoardReader even more invaluable is the fact that you can subscribe to searches so any time a new mention occurs you are automatically notified. Just perform a search and click the “See Tools…” link at the top to subscribe. My personal preference is RSS (no, it’s not dead), but setting up a personalized home page isn’t a bad idea either. Jump in the conversation if you want, but do it respectfully and don’t hide your connection to your brand.

Blog Posts

There are numerous blog search sites. The important thing to remember is that all of them are good besides Google’s. My personal choice is Icerocket. Just do a search and click the Results RSS link on the left. Pop that into your RSS Reader or personalized home page and you’re set.

News

In reverse of my section on blog posts, Google News actually works pretty well here. Just search your brand and find the RSS link at the very bottom of the page. Rinse and repeat on the RSS Reader or personalized home page.

Backlinks

If you’re asking yourself what are backlinks, well, you should learn some SEO. Backlinks are the most important part of search engines’s algorithm. They determine the authority of your website. SEOMoz has a great post on using Yahoo! Pipes to track new backlinks.

Now, all of this can be applied to your competition, so if that’s important, replicate these suggestions with your competitors’ brand names for competitive research.

So, now that you know how to track it, what are people saying about you?

Data Mining for Media Buying (Media Buying Part II)

Read part 1 of of my series on media buying.

In my last post, I talked about evaluating the targeting options available in a media buy, and really making smart choices about how targeted you need to purchase your media. Now I’d like to talk about using data to enhance the media buying process at each step of the process. No, I don’t mean the incredibly irrelevant Nielsen data that you have to pay a bunch of money for, nor do I mean the statistically irrelevant traffic/audience measurement tools that are available for cheaper or free (Comscore, Compete, and Quantcast exist, but they are so wildly inaccurate it is not worth making decisions based on their data).

I’m taking about your data. As a business, you likely have some data of customer lifetime value, historical cost per acquisition of a new customer, conversion rates from paid media sources, and repeat purchase rate. If you don’t have that, use assumptions or make numbers up as you go a long (I’ll explain that in more detail later).

As I said in part 1 of this blog post, every vendor should be able to provide some data of theirs to you about a potential media buy. This typically is an impression number. Impression data basically amounts to an estimated number of the maximum number of people who would see your advertisement. Depending on how they calculate this data (always ask), you may want to adjust the number (if they use a very conservative methodology, you may want to multiply it. If they use a shaky method that is not very conservative, you may want to only count a percentage of it). If you’re buying ads on the exteriors of buses for example, some vendors may use the bus ridership data to provide impression data. Those people may be likely to see the ad before they enter the bus, but this data ignores all of the pedestrians and drivers who also may see these ads. Keep that in mind.

Once you have impression data, you also have a cost quote from the vendor attached to the buy. From this, you can calculate a CPM (Cost /(Impressions/1000)). This is the standard cost measure for media buying, so it’s good as a comparison tool. Frequently, if you’re buying different pieces of media from the same vendor, the impression and cost data is broken out by each type of media. This can help you understand what pieces of media are the most expensive and may not be worth the price (more expensive does not necessarily mean more effective for you).

Once you have this data, you can estimate how many people enter your store, visit your website, call your number, or whatever your goal based on these impressions. That should be your conversion rate. If this percentage isn’t very small, you’re probably over-estimating. For example, one media buying/targeting option might generate a million impressions. I could estimate based on previous buys (or just pull a conservative number out of thin air) that 1% of those impressions visit my website, and from there 2% make a purchase. That equals 200 sales. If you don’t have this data or are a new business, estimate using industry benchmarks or whatever forecasts you have (2% is the ecommerce conversion rate average, for example). If another targeting option using that same approach projects to generate 100 sales for the same price, it’s probably not the option you want to choose of the two.

200 sales?! That’s great! Is it? This is where you should look at how much you paid for those sales, how much you earned from those sales, and how many more sales you should expect from those customers. Cost per acquisition measure how much it cost to acquire each customer. This should be compared to the revenue/profit of that sale and the lifetime revenue/profit you expect from that new customer (if it is a new customer. Keep in mind an advertisement may just drive existing customers back). If those 200 sales or the lifetime value of those 200 new customers equal more revenue/profit than the cost per acquisition, you’re possibly looking at a media buy you can pull the trigger on.

If that is the case, from a negotiation perspective, you’re sitting pretty. You have a deal you can bite on, and can just make some attempts to lower the price to make it even more profitable. A good way to make that attempt is to pretend those 200 sales or their lifetime value do not equal more revenue/profit than the cost per acquisition of the buy. If this really is the case (or you’re pretending it is), you can use this data to arrange a price more to your liking. One thing salespeople are not equipped to do is argue with your company’s data. If your data says this buy is not going to be profitable (or you’re pretending the analysis says that), they have to assume they won’t receive the sale unless they make it more enticing. This is one component not covered in Tim Ferriss’s ad buying negotiation tips that absolutely should be. Salespeople are not typically very analytical, so even if there are holes in your data, salespeople are not going to question your assumptions.

Once you’ve negotiated a better deal using data, it’s time to collect real data on how the media buy is performing. Is it profitable? Should I do it again? These are questions I hear a lot from advertisers they can know themselves with a little planning. Most advertising campaigns (except for extremely established brands) are meant to acquire new customers. At any point of sale, website confirmation process, or phone call, you can typically set up your system to tell if someone is a new customer. When you receive a sale from a new customer, just ask how they heard about you. On our website, any time a new customer places their first order, we have a one question survey that asks how they heard about us, and the answers are pre-filled with our marketing mix. 70% of people respond to that. That’s pretty good data. All you have to do is tally up that data to see if you’re receiving enough sales to justify doing the buy again. You can also track if these customers make repeat purchases. Refine your conversion data and lifetime value data for future buys with this data.

Here is an Excel template that can help get you started.

Data can make media buying a regimented, almost automated process that can come close to guaranteeing profitable media buying purchases. So, I challenge any one currently purchasing media today, what data are you using?